The U.S. Securities and Exchange Commission (SEC) has raised concerns about recent spot bitcoin exchange-traded fund (ETF) filings, saying they are inadequate. This comes after wealth management giants BlackRock and Fidelity submitted their applications for the launch of spot Bitcoin ETFs.
The Wall Street Journal reported that the SEC shared its views on the filings with Nasdaq and Cboe. In particular, the Agency stated that the documents lacked clarity and completeness.
After the publication of this news, Bitcoin saw its value drop by almost 2%. Other altcoins, including XRP, also saw declines on their respective charts.
Over the past 24 hours, XRP has seen a decline of around 1% while on the weekly chart it has lost more than 4%. As a result, the technical outlook turned bearish, leading to a drop in investor interest.
The charts reflected a decline in both demand and accumulation. Currently, XRP is hovering around a key support level and a break of this level could potentially trigger an upside move for XRP. XRP’s market cap declined, suggesting that sellers had a tighter grip on the market.
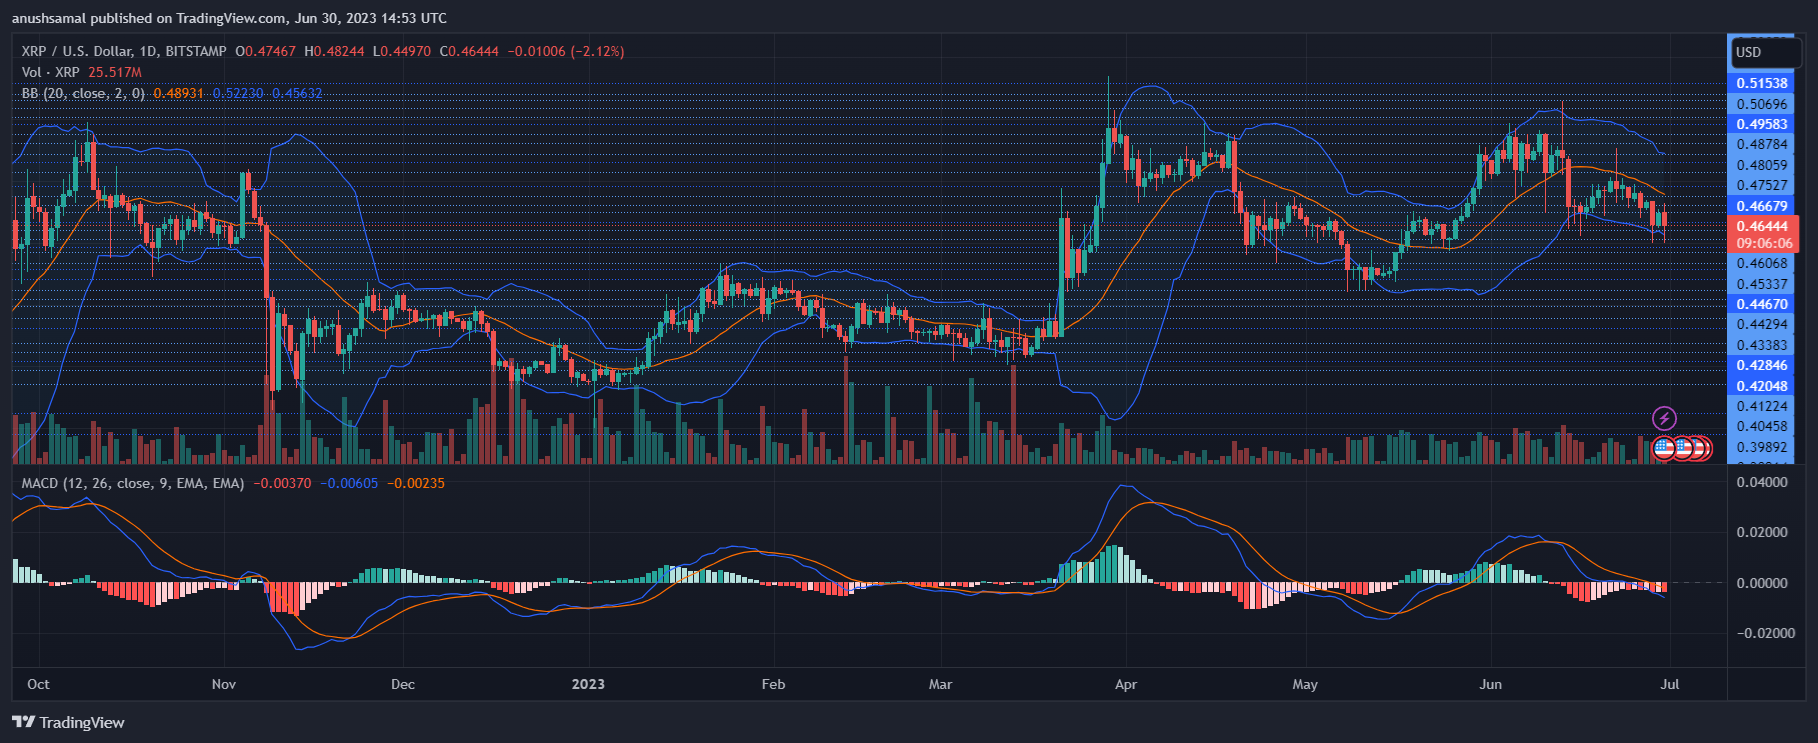
XRP Price Analysis: One-Day Chart
The price of XRP was $0.46 on the one-day chart | Source: XRPUSD on TradingView
At the time of writing, altcoin XRP was trading at $0.46. Currently, XRP has reached its lowest level since late May. This level has acted as a key support level for the coin in the past. This level is often referred to as a bullish order block and has the potential to drive a price rally.
Looking ahead, the first hurdle for XRP would be resistance at $0.48, followed by a possible move above $0.50. However, if XRP encounters another rejection at $0.50, it could see a return to trade at $0.46 and possibly even a further decline to $0.43.
Technical Analysis
XRP showed low demand on the one-day chart | Source: XRPUSD on TradingView
Due to the low demand, interest in buying has declined. The Relative Strength Index (RSI) is currently below the half line and near the 40 level, suggesting that buyers have lost their grip and sellers have gained control.
Likewise, XRP has fallen below the 20-Simple Moving Average line. This points to an easing of demand and implies that sellers are currently driving the price dynamics in the market
 XRP showed a sell signal on the one-day chart | Source: XRPUSD on TradingView
As demand for the altcoin decreased, the altcoin generated sell signals, although those signals became smaller and smaller. This suggests that the downside momentum may be fading.
The Moving Average Convergence Divergence (MACD) showed red histograms associated with the sell signals, but decreased in size. This suggests that while there was still bearish sentiment, the price could potentially see a bounce in the near future.
When looking at volatility, Bollinger Bands are used. In this case, the bands were wide and parallel, indicating a range for the altcoin. The upper band corresponding to the $0.52 price level is expected to serve as a significant resistance level.
Featured image from Unsplash, charts from TradingView.com
 Flatlines – is an outbreak or outbreaks?")
 sparks new momentum: bulls aim for higher ground")